Opportunities Management Dashboard
June 2021
Snapshot of Full Report
< Selection Criteria – single or multiselect
< Opportunity Amount by Status Stats
< Status by Stage and Sales Rep
< Status by Month by Sales Rep
< Status by Month by Business Unit
< Status by Month by Product
< Percent by Stage / Loss Reason
< Month Leaderboard
General Dashboard Functionality
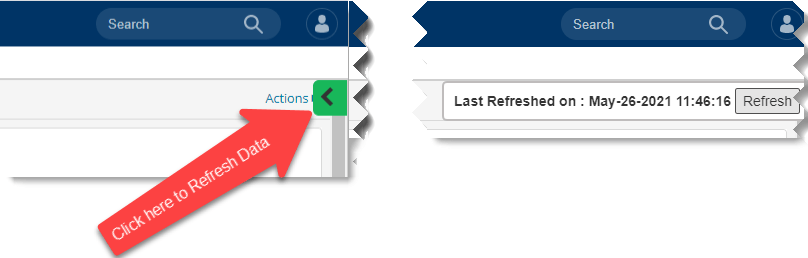
Refresh Data for current data reporting, timely review and decision making.
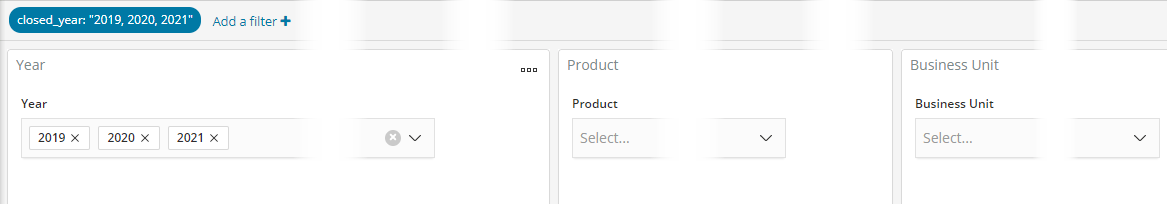
Flexible Data Selection Criteria
All Years, Products, and Business Units listed in the dropdown menus are represented in the graphs and tables unless filters are applied. Use the dropdown selections and other dynamic filtering options to easily change reporting.
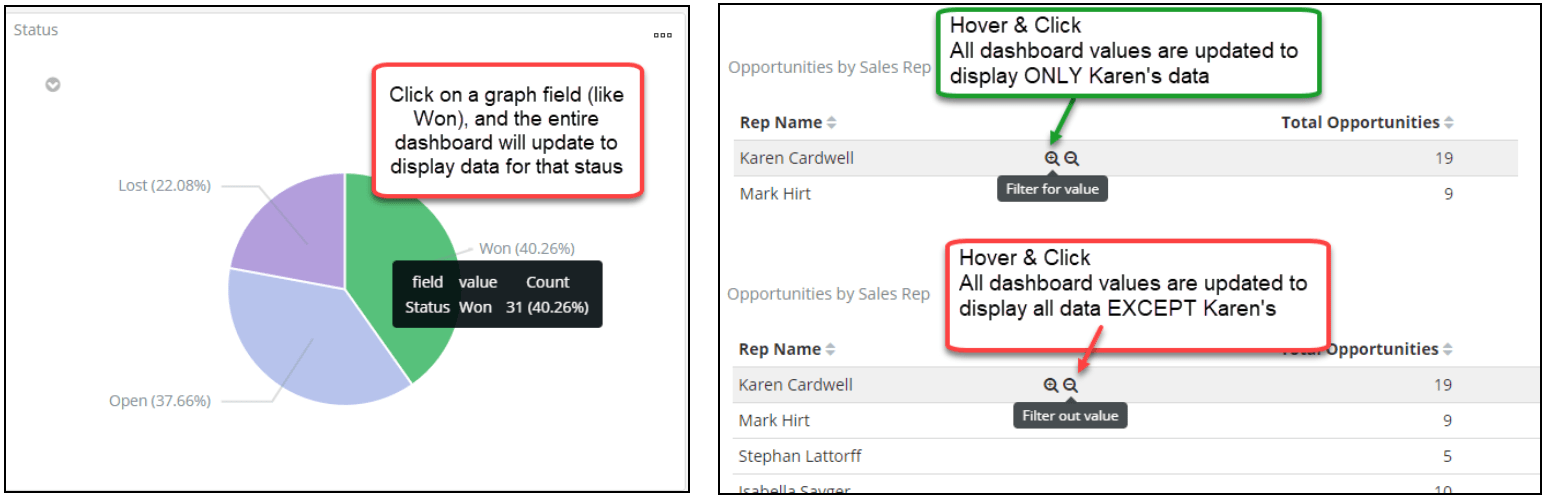
Additional Dynamic Filtering Options
Update the entire dashboard by clicking on a section of a graph or on the magnifying glass in a table.
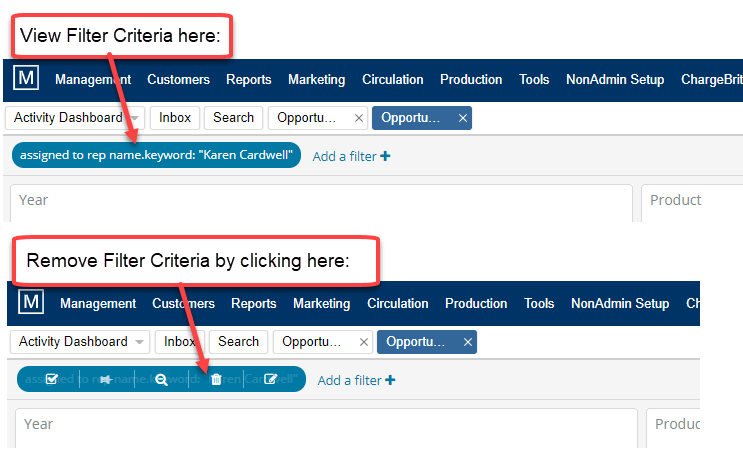
Remove Filters
All filter selection can be viewed at the top of the dashboard. Remove filters by hovering over the filter and clicking on the trashcan.
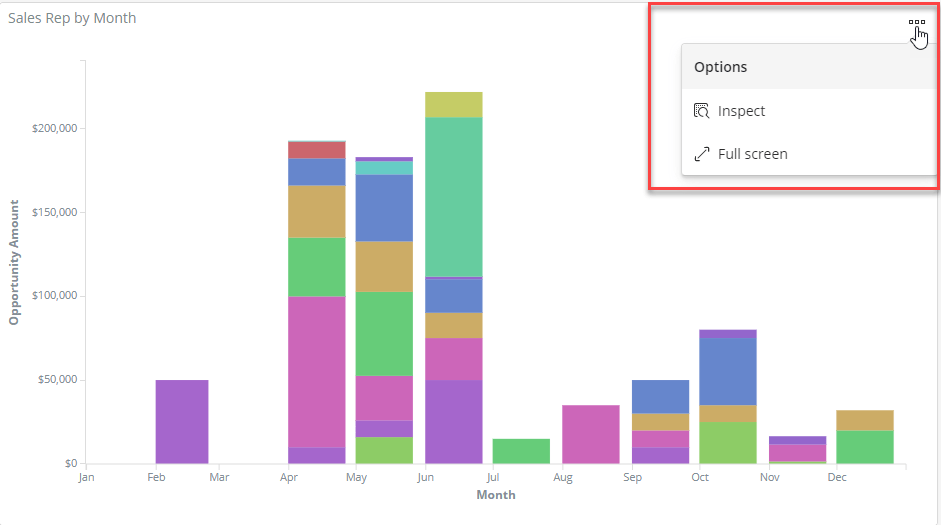
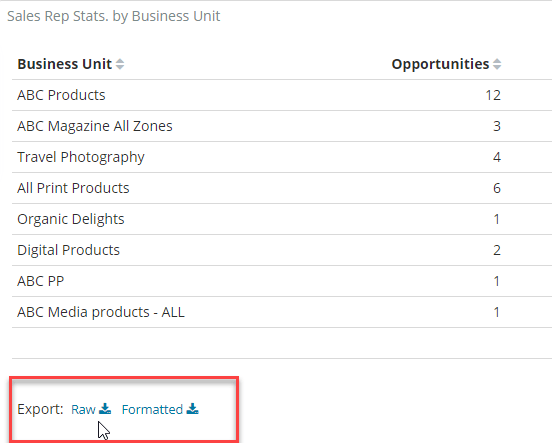
Isolate, Inspect, or Export Graph or Table
Opportunity Dashboard Specifics
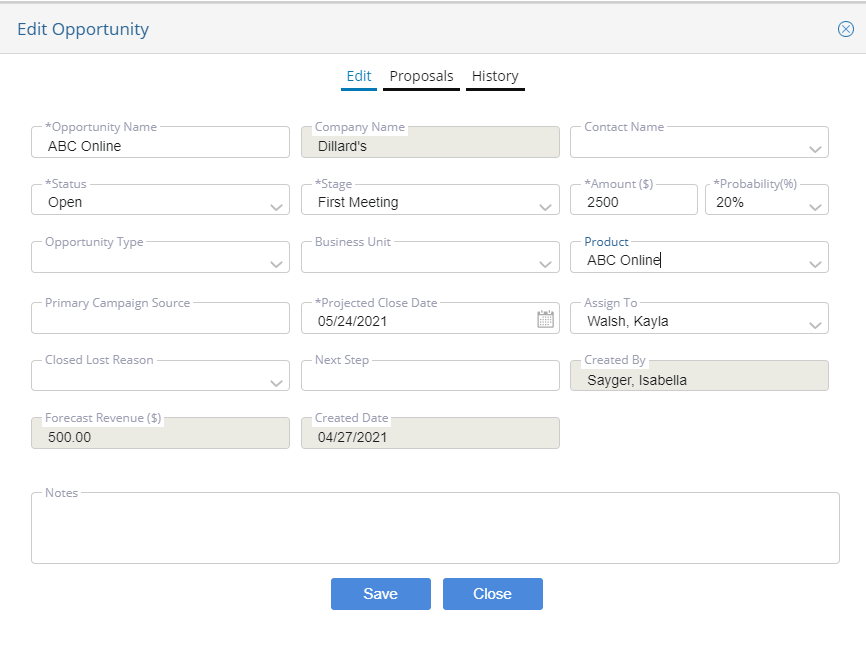
IMPORTANT: Note most information in this dashboard is derived from entries during the opportunity creation and updates made while working the opportunity pipeline. Encourage your team to fully complete this information and keep it updated!
Year, Product, & Business Unit Selection Criteria
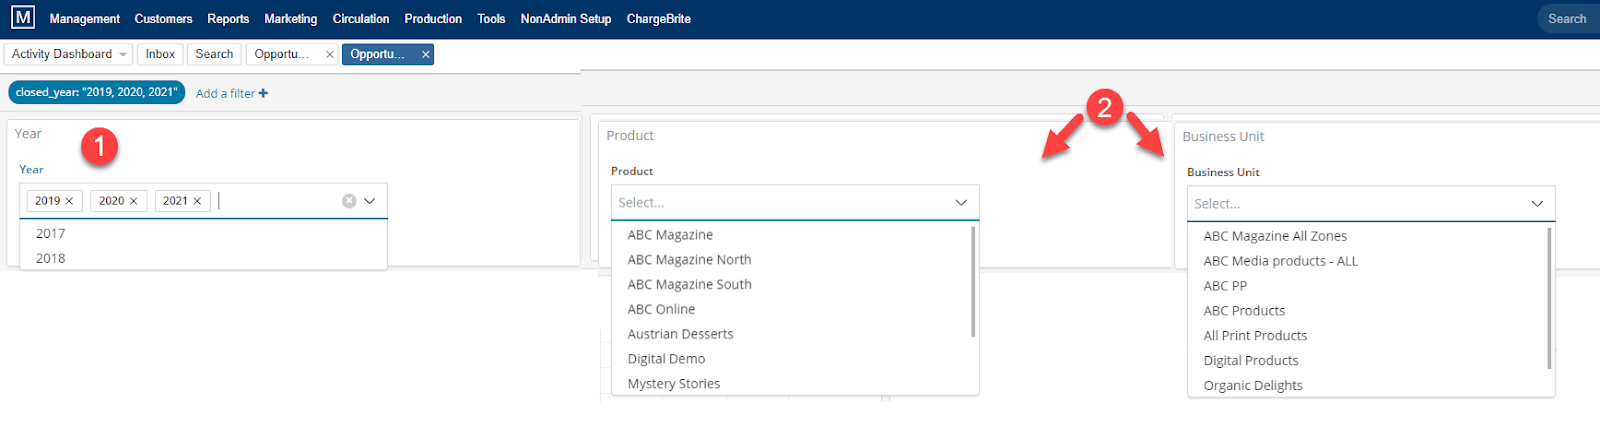
Year Selection
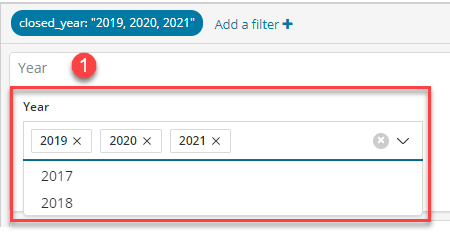
To begin using this helpful management report, open the dropdown menu to view all available years in the system. By default, it will pull and display data for all years listed.
Note that the “Year” refers to the Year Closed for the opportunity. This is the Projected Close Date for Open Opportunities and the Converted Date for opportunities moved to Won or Lost status.
To filter data or view multiple years at one time, you can multi select from the listed years. The screenshot is set to display data for 2019, 2020, 2021.
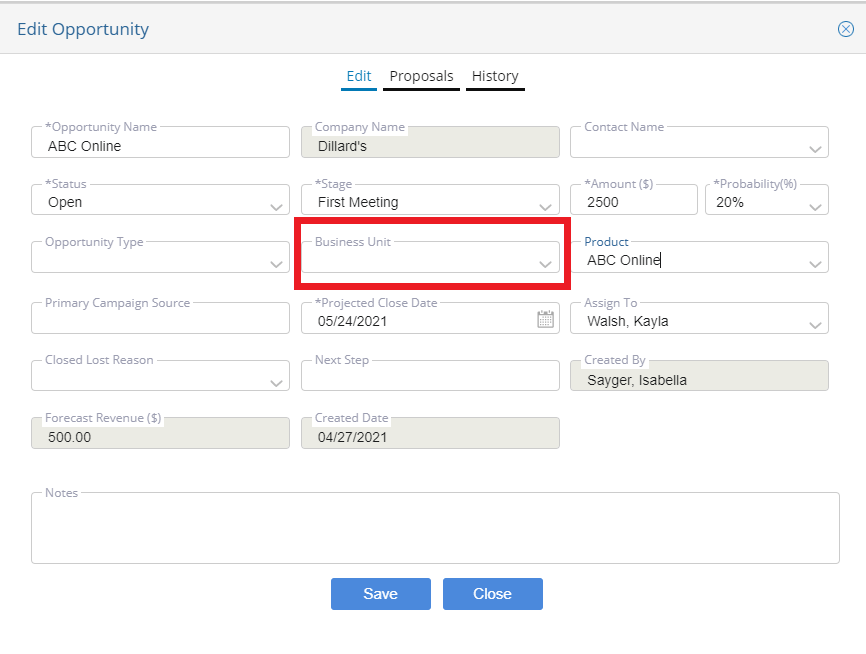
Product and Business Unit Selections
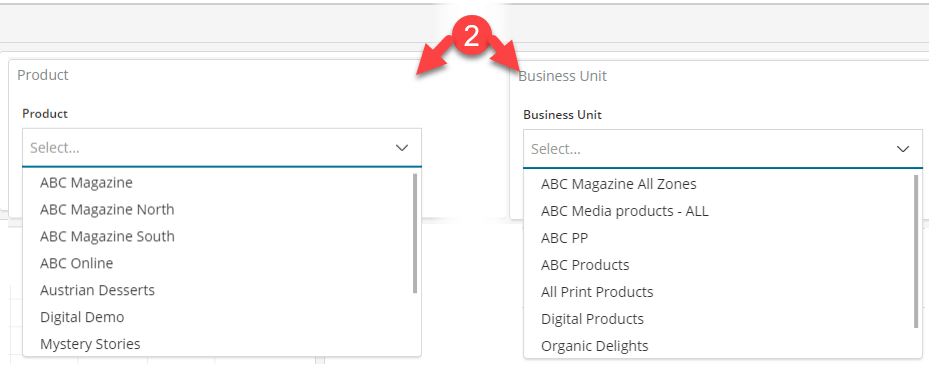
By default, data will be listed for all business units and products input during the Opportunities Creation step. Use the dropdown options to make a single or multiple selection
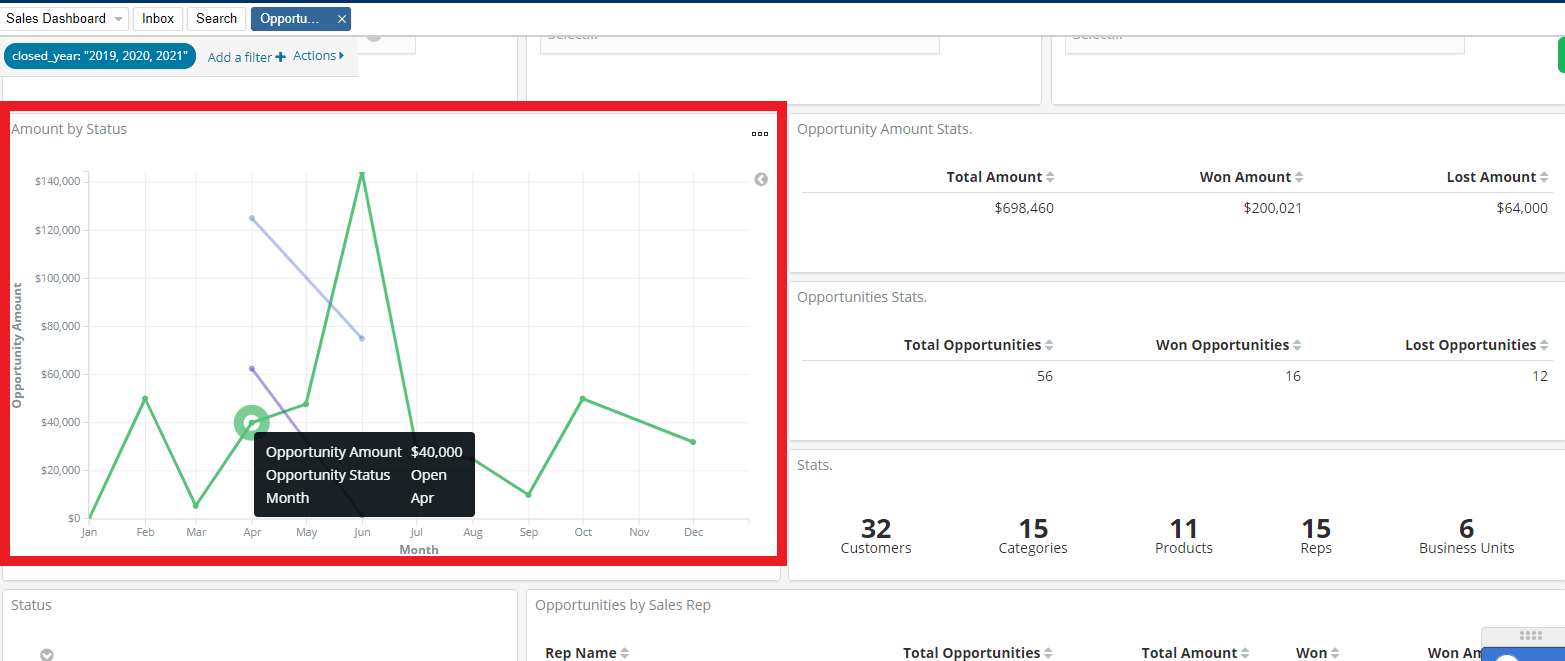
Amount by Opportunity Status Graph
The three opportunity stages will display as different lines on the graph. Hovering over each line will show you the Opportunity Amount, Opportunity Status and Month. For example, the green line represents Open opportunities, while the blue line represents Won opportunities and purple represents Lost opportunities. The month displayed for Open opportunities is based on the projected close date while both Won and Closed opportunity dates are displayed on the conversion date.
The general stats to the right of the graph include total dollar amount by opportunity type, number of opportunities by type, and number of customers, categories, products, reps, and business units represented in the opportunity selection criteria.
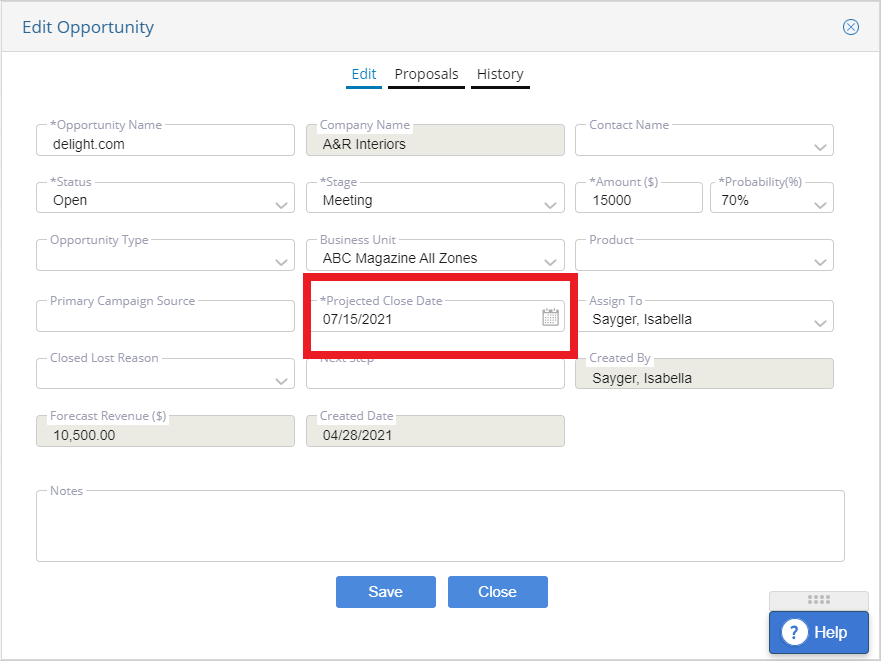
The Open opportunity month is populated based on the Projected Close Date. Encourage teams to keep this updated for accurate reporting.
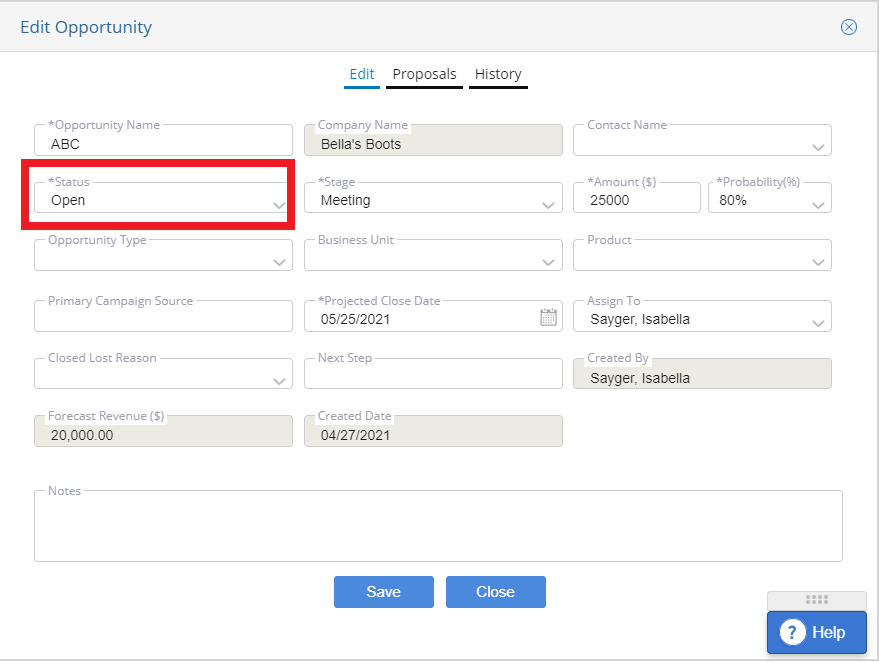
Won & Lost opportunities populate the month it was manually moved to “Won” or “Lost” statuses. For example, if this opportunity was moved from Status: Open to Status: Won on 6/1/2021, then there would be a blue data point for June on the graph– not on the 5/25/2021 projected closed date .
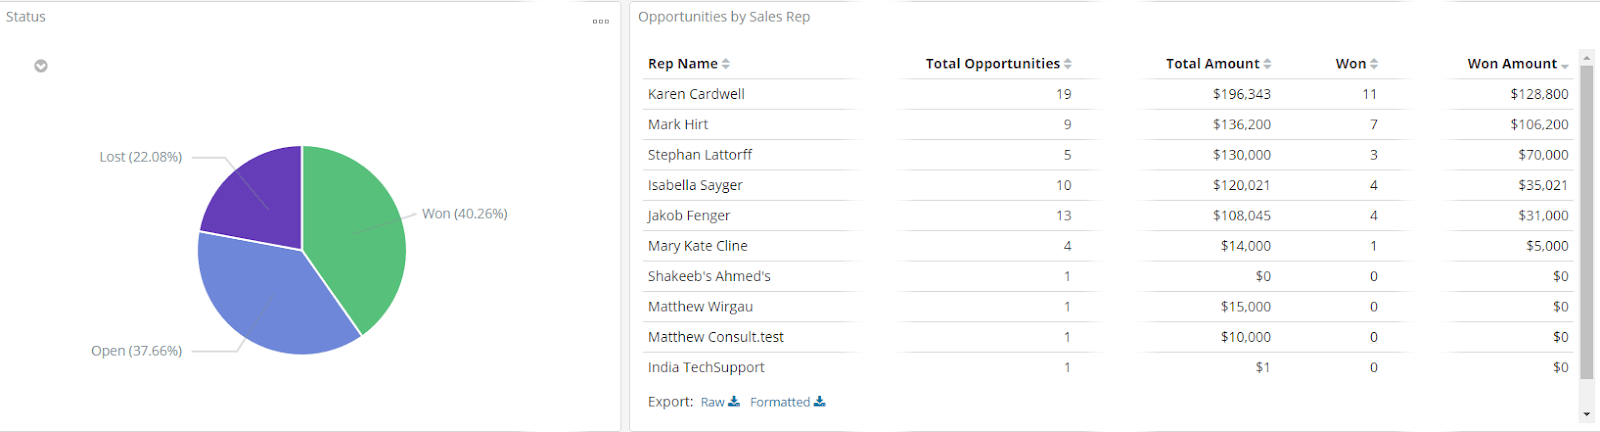
Opportunity Stats by Status & by Sales Rep
Stats by opportunity status (Open, Won, Lost), and Rep Stats for number & dollar amount are based on the dropdown or dynamic filtering options available.
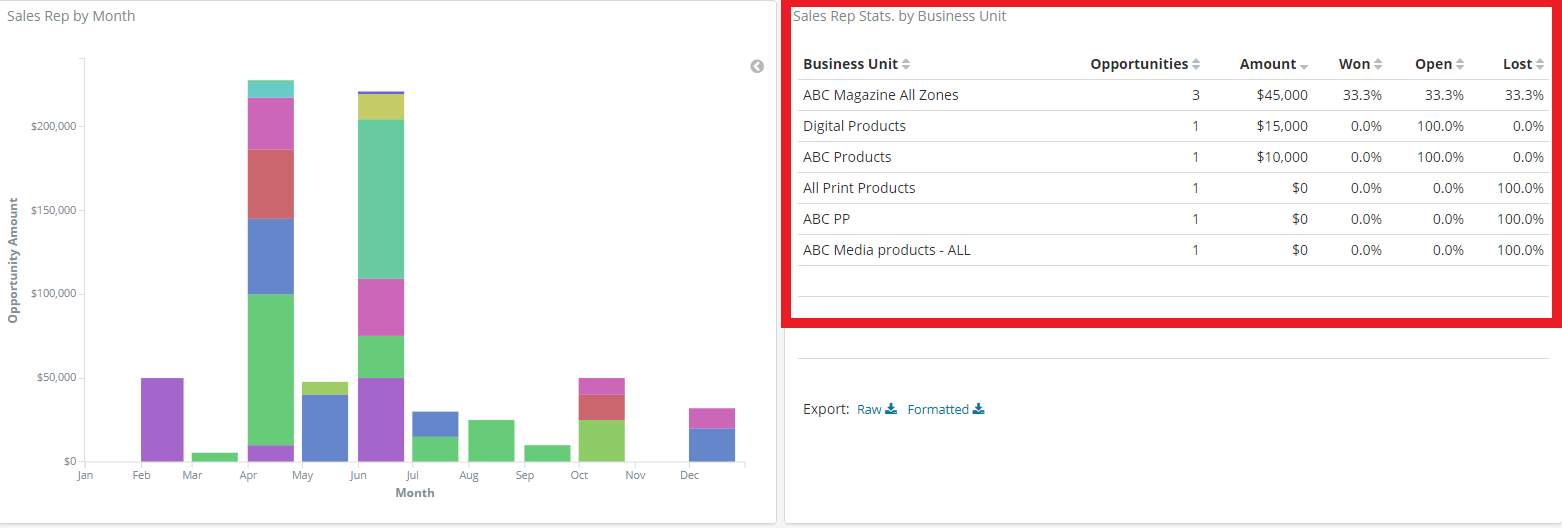
Sales Rep Stats by Month & Business Unit Stats
Data displayed on the Sales Rep Stats and Business Unit Stats widgets are based on the dropdown or dynamic filtering options available. Click on a sales rep on the graph or filter any sales rep on the table to dynamically change the dashboard view.
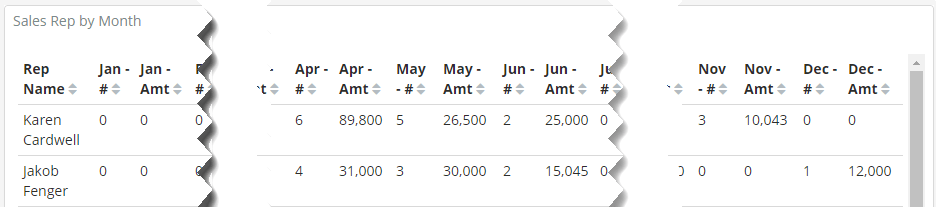
Sales Rep by Month Table
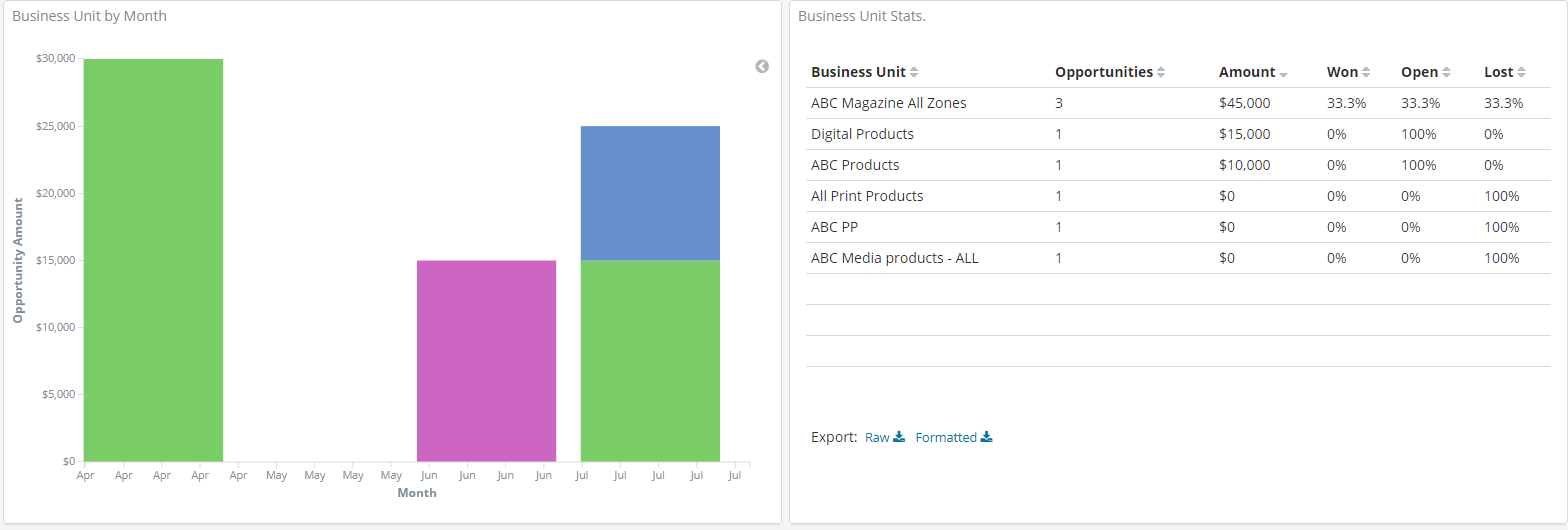
Business Unit By Month
Dynamic filtering can change the dashboard by clicking on a business unit on the graph or filtering in or out a business unit in the table.
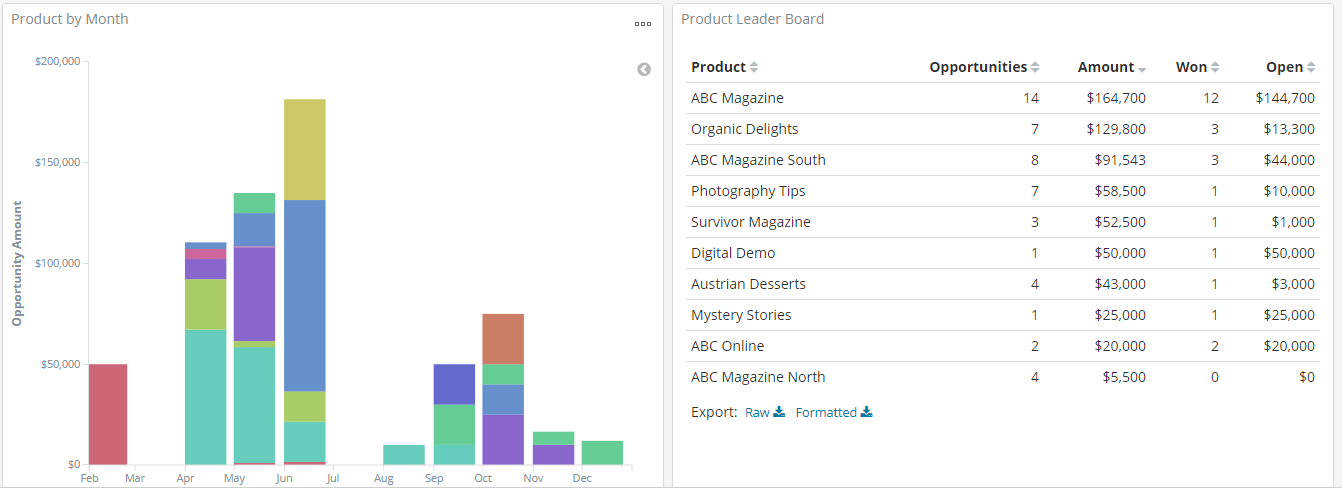
Product By Month & Product Leaderboard
Dynamic filtering can change the dashboard by clicking on a product on the graph or filtering in or out a product in the table.
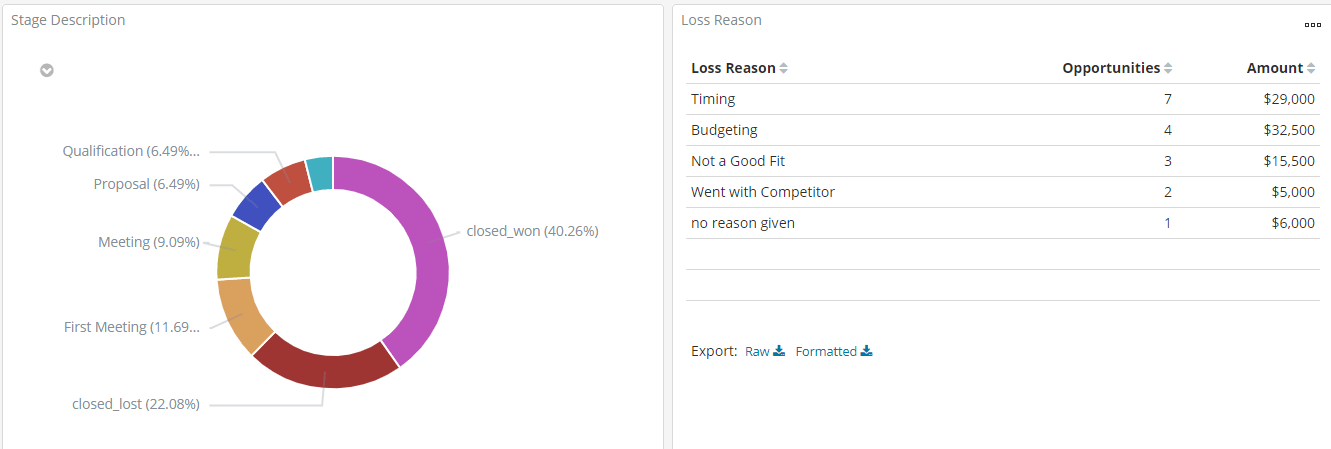
Percentage by Stage and Loss Reasons
Dynamic filtering can change the dashboard by clicking on a stage or filtering a loss reason.
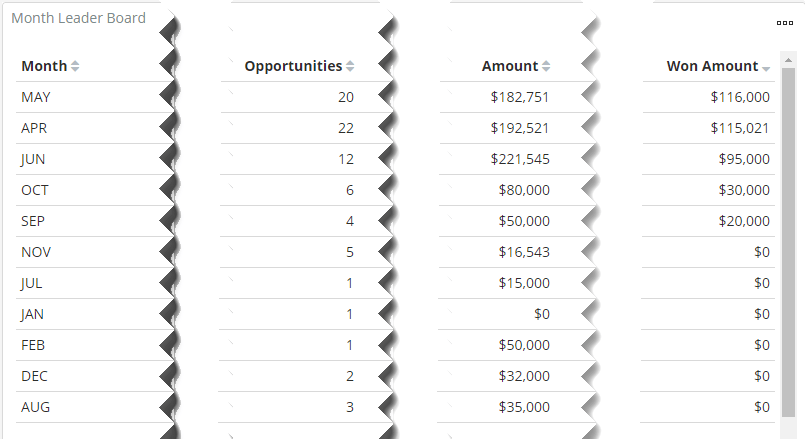
Month Leaderboard
Opportunity number, dollar amount, and won dollar amount. Months can be filtered in or out by using the magnifying glass that appears when hovering next to the month.
We want to hear from you!
videos relating to


