The Revenue & Goals Module within the CRM explicitly allows users to create sales report, set goals and filter the results using Product, Sales Rep and Customer all at one place.
Navigation: Reports >> Report Suite >> Revenue & Goals Module
How to Search within the Revenue & Goals Module
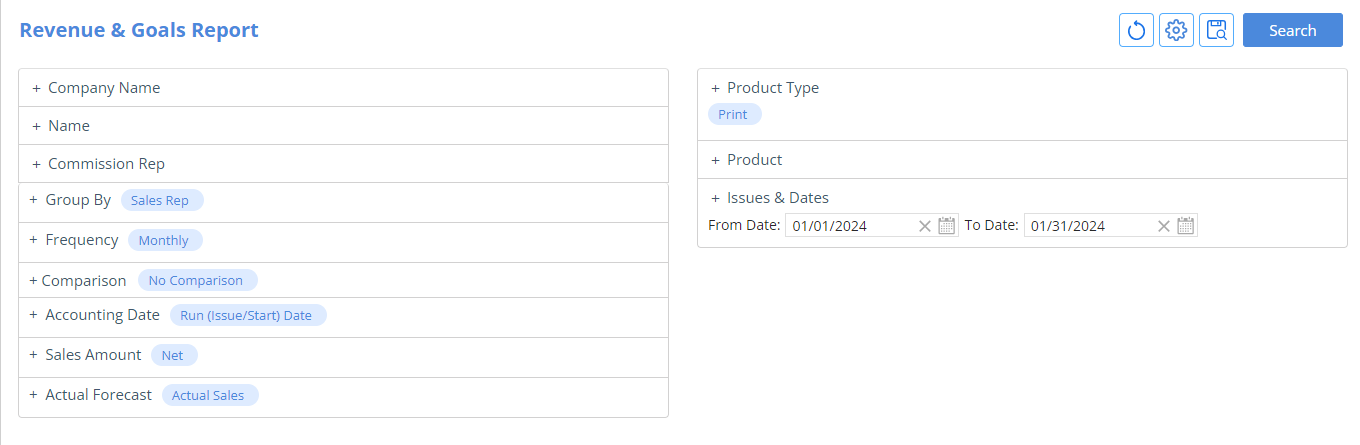
Search Options and Filters:
- Company Name
- Name
- Commission Rep or Account Rep
- Group By: Customer, Product or Sales Rep
- Frequency: Daily, Weekly, Monthly, Quarterly, Yearly, By Issue
- Comparison: Additional Comparison Options – No Comparison, Compare with Previous Year, Percent Change from Previous Year, Compare & Percent Change from Previous Year
- Accounting Date: Booking/Create Date, Run (Issue/Start) Date, Billing Date
- Sales Amount: Net, Cash (Net – Barter), Barter
- Product Type
- Product
- Issues & Dates: ‘Search by Issue’ or ‘Search by Date’
- Actual Forecast: Actual Sales and/or Forecast Sales (Proposals)
-
- If Actual Sales is selected – the dollar amounts on the report will show Order data
If you click on the dollar amount – the details window will show amount broken down by Orders
-
- If Forecast Sales is selected – the dollar amounts on the report will show Proposal data
If you click on the dollar amount – the details window will show amount broken down by Proposals
-
- If both are selected – the dollar amounts on the report will be Orders + Proposals
A Settings option available within the Revenue & Goals Module Search Page lets users set the Module to either default open to the Search/Criteria page or the Quick Search/Results page.


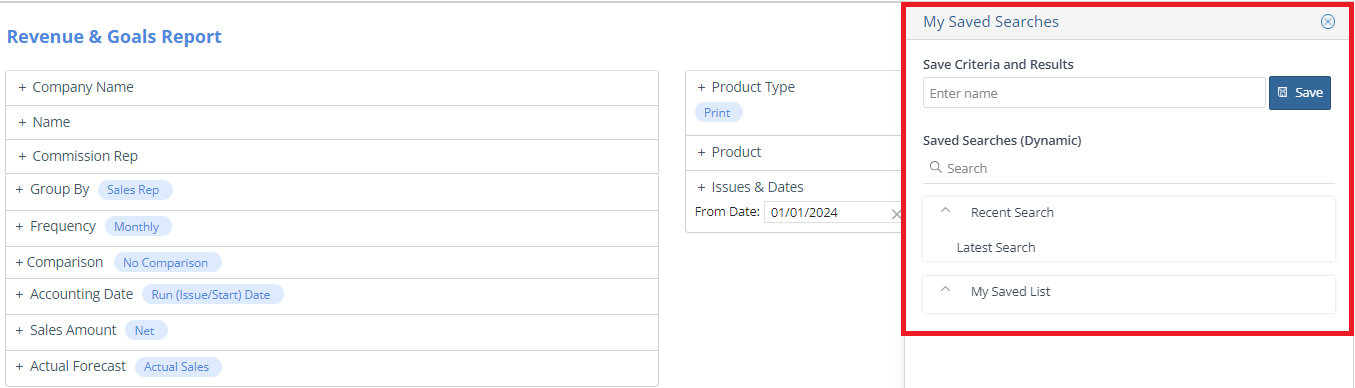
Saved Search helps users to save the selected search criteria for commonly performed searches.
How to use the Revenue & Goals Module Search Results Page
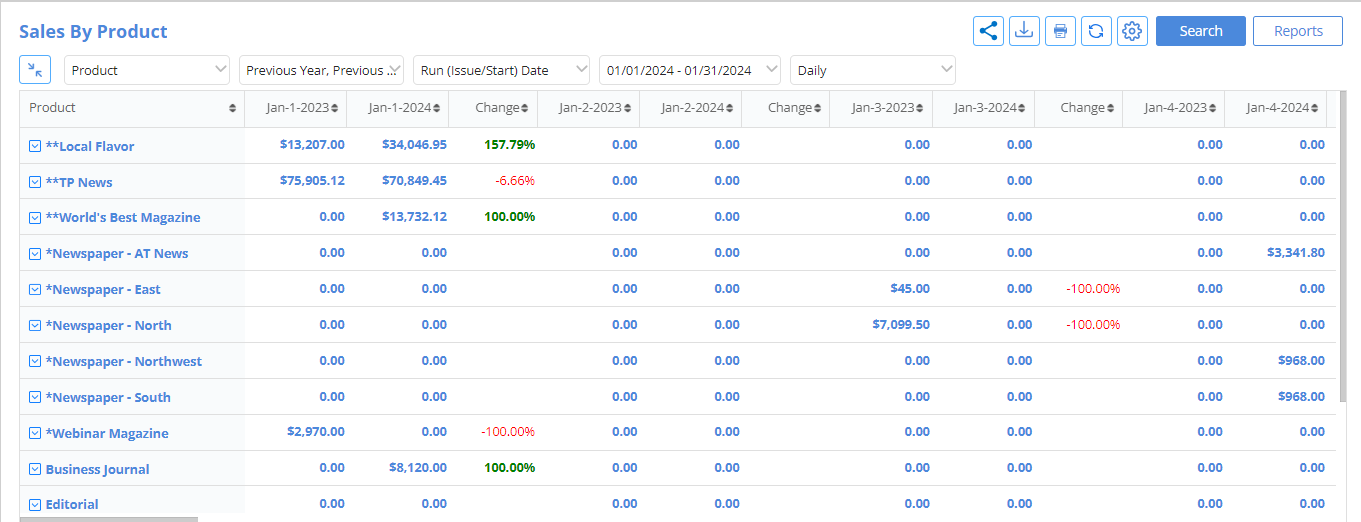 The ‘Share Report’, ‘Print ‘,’Export’ and ‘Settings’ buttons appear at the top-right corner of the Search Results Page. ‘Settings’ option will open the Edit Report window for the Report that is currently selected.

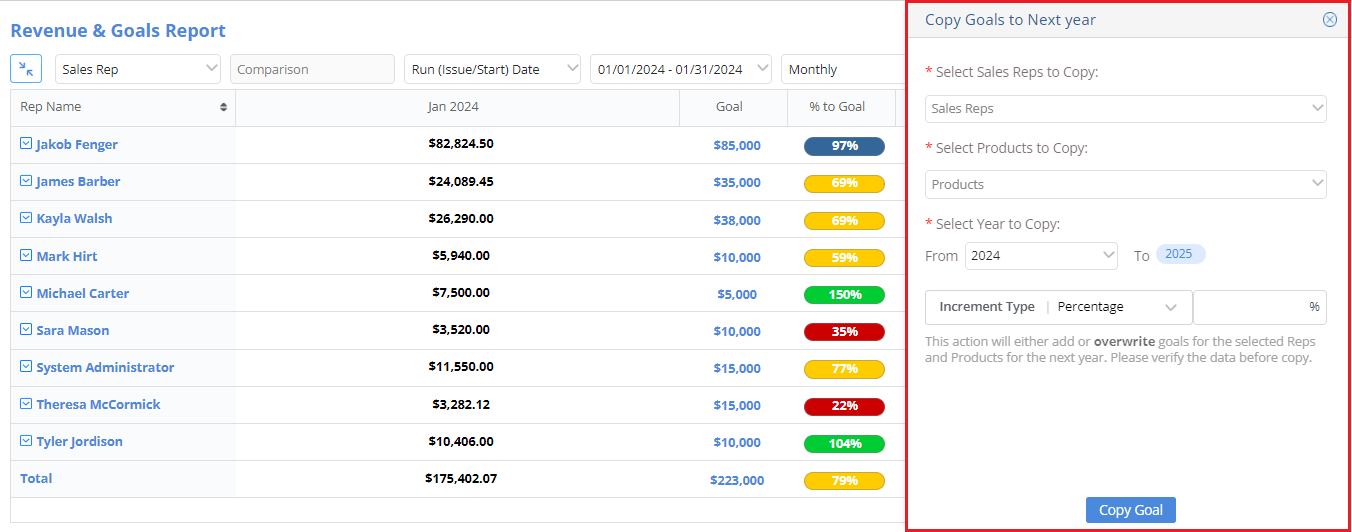
Additionally, a ‘Copy Goals’ icon will also be available for System Administrators to copy goals for the selected reps and products to the next year. Please contact your Software Consultant for copying goals.

- Copy Goals will open up a split screen asking the SA to enter the Goals that they want to copy to the next year based on selected reps, products or a previous year.
Increment type field: SA can enter a percentage or an amount value to add/overwrite when copying these goals to the upcoming year.
 Results Quick Change:
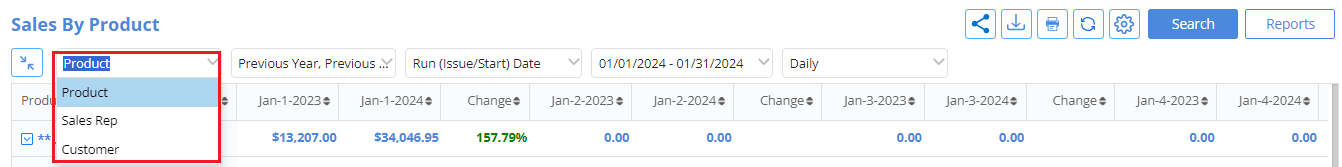
At the top left of the page, there are 5 filters to allow users to quickly filter their search results, alongside a button for ‘Expand/Collapse’ used for the internal groupings –

- Group By drop down – Customer, Product, Sales Rep
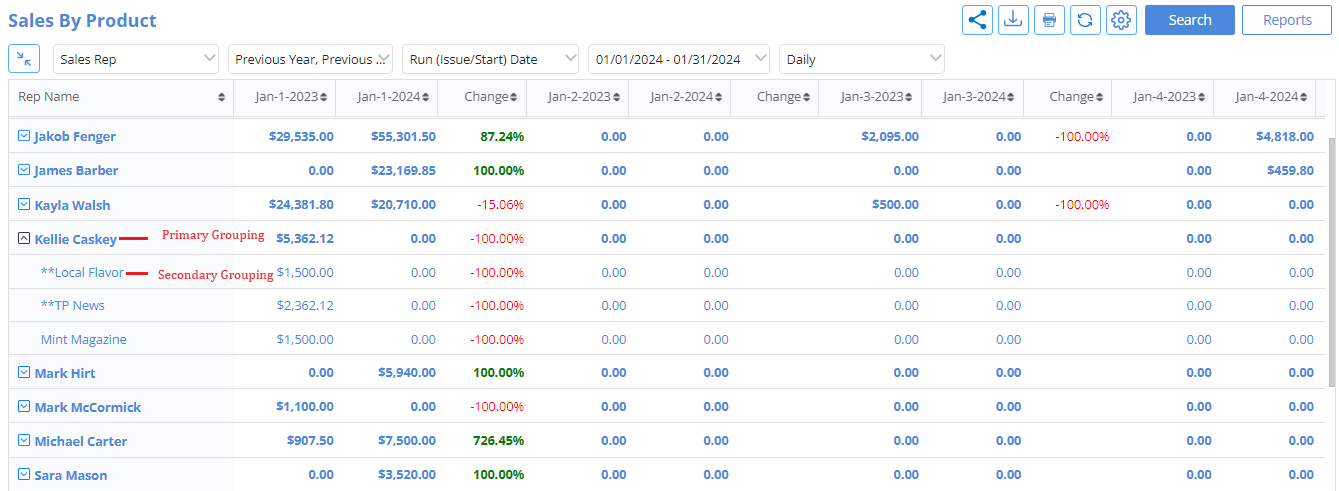
- Each row on the report will be expandable. Once expanded, users will see another set of rows with secondary grouping for the sales data. The primary Grouping will be in a bolder font and the clickable secondary groupings will be in a normal font. Users can have multiple rows expanded at a time.
- Each row on the report will be expandable. Once expanded, users will see another set of rows with secondary grouping for the sales data. The primary Grouping will be in a bolder font and the clickable secondary groupings will be in a normal font. Users can have multiple rows expanded at a time.
-
-
- If the report is Sales by Product, the secondary grouping is by Rep.
- If the report is Sales by Rep, the secondary grouping is by Product.
- If the report is Sales by Customer, the secondary grouping is by Product.
-
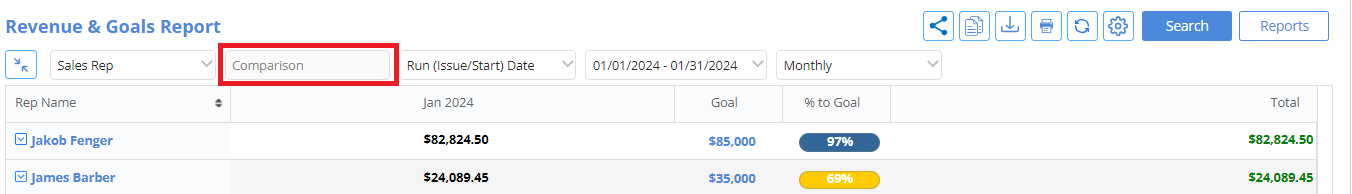
- Comparison dropdown – No Comparison, Compare with Previous Year, Compare & Percent Change from Previous Year.

-
- If neither option is selected, the search will default to No Comparison.
- Previous Year only, the search will compare with the previous year.
- Previous Year % only, the search will show percent change from previous year.
- Previous Year & Previous Year % selected, the search will show compare & percent change from previous year.
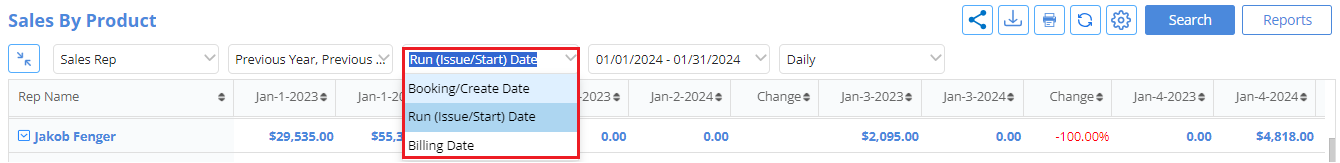
- Accounting Date dropdown – Booking/Create Date, Run (Issue/Start) Date, Billing Date
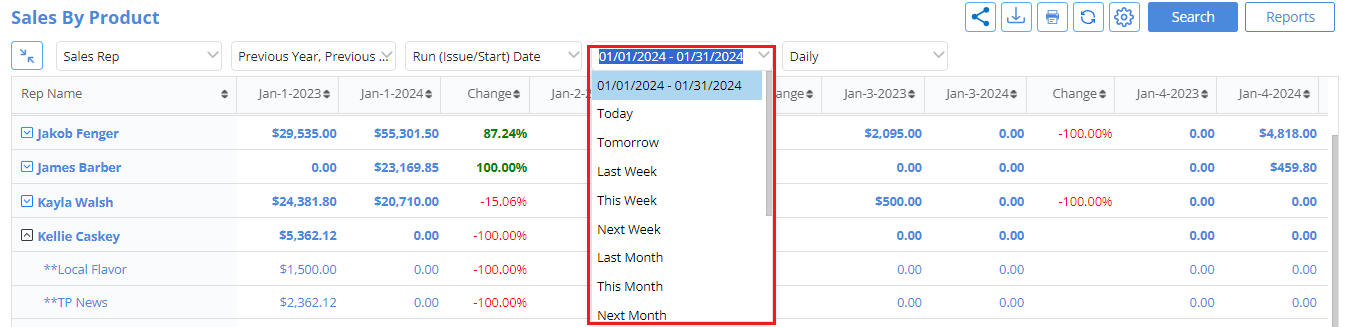
- Time-frame dropdown – Dates selected on the search page, Today, Tomorrow, Last Week, This Week, Next Week, Last Month, This Month, Next Month, Last Quarter, This Quarter, Next Quarter, Last Year, This Year, Next Year
- Frequency dropdown – Daily, Weekly, Monthly, Quarterly, Yearly, By Issue
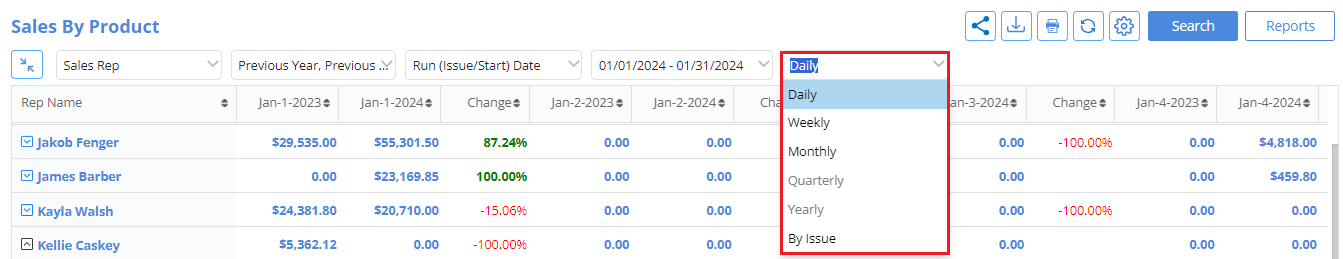
NOTE: Based on the Date Range/Time-frame selected, the Frequency options available will be automatically filtered and, based on the Date Range/Time frame selected, the unavailable Frequency options will appear grayed-out and unclickable.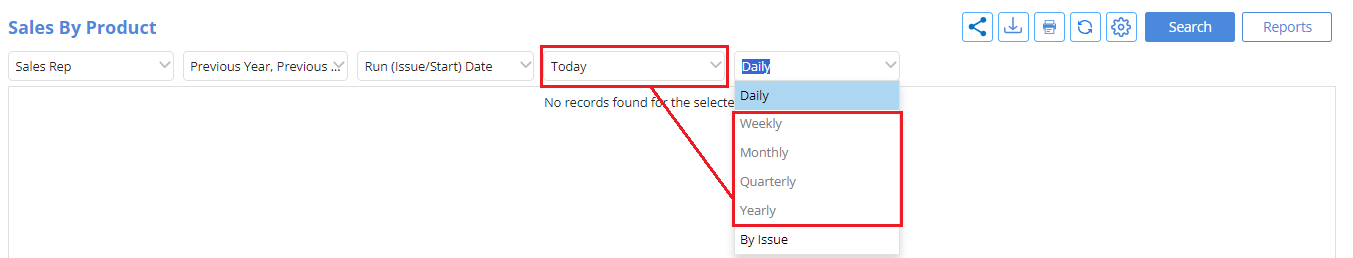
-
- Frequency Available By Date Range:
- Less than 1 week> Daily*, By Issue
- Greater than 1 week, Less than 1 month> Daily, Weekly*, By Issue
- Greater than 1 month, Less than 6 months> Weekly, Monthly*, By Issue
- Greater than 6 months, Less than 1 year> Weekly, Monthly*, By Issue
- Greater than 1 year> Weekly, Monthly, Yearly*, By Issue
- Frequency Available By Date Range:
-
- Frequency Available By Time frame:
- Today, Tomorrow> Daily*, By Issue
- Last Week, This Week, Next Week> Daily*, Weekly, By Issue
- Last Month, This Month, Next Month> Daily, Weekly*, Monthly, By Issue
- Last Quarter, This Quarter, Next Quarter> Weekly, *Monthly, By Issue
- Last Year, This Year, This Month> Weekly, Monthly*, Quarterly, By Issue
- Frequency Available By Time frame:
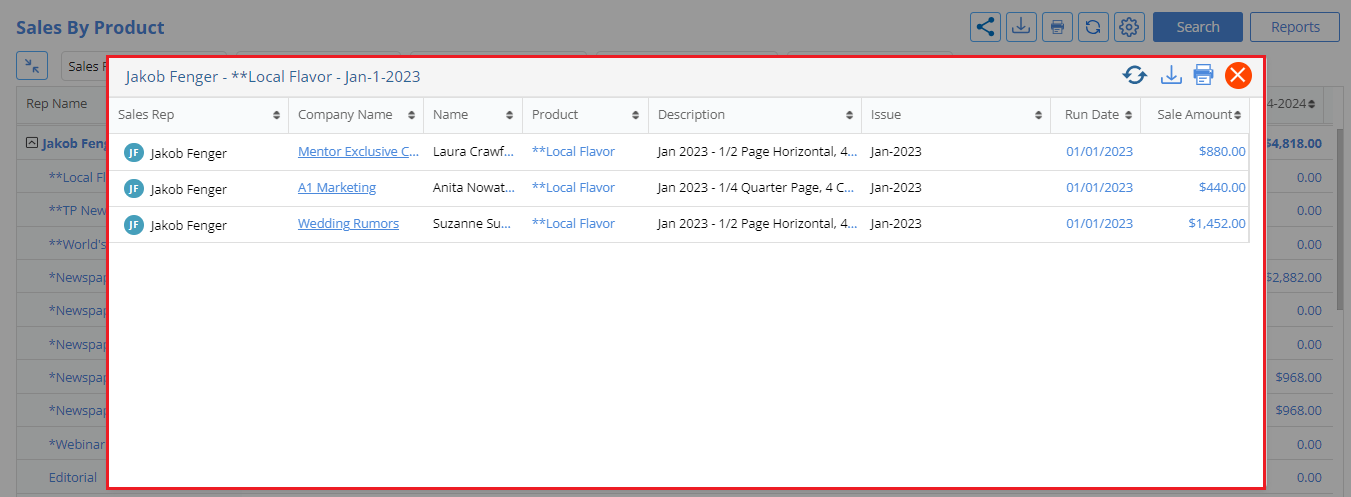
Single clicking the dollar amount for an individual Customer, Rep or Product will open the Sales Details Modal Window where the user will see the total dollar amount broken down by orders. Users can Export to CSV and Print directly through this window.
How to Save the Reports in the Revenue & Goals Module
This feature can be accessed by clicking on the Reports Button and includes the below –

Standard Reports: Sales By Product, Sales By Rep and Sales By Customer. These reports will be available by default and cannot be deleted or edited.
Global Reports: Reports that are set to ‘Public’ will be visible to all users
My Reports: Reports that are set to private will be visible only to the user who created them
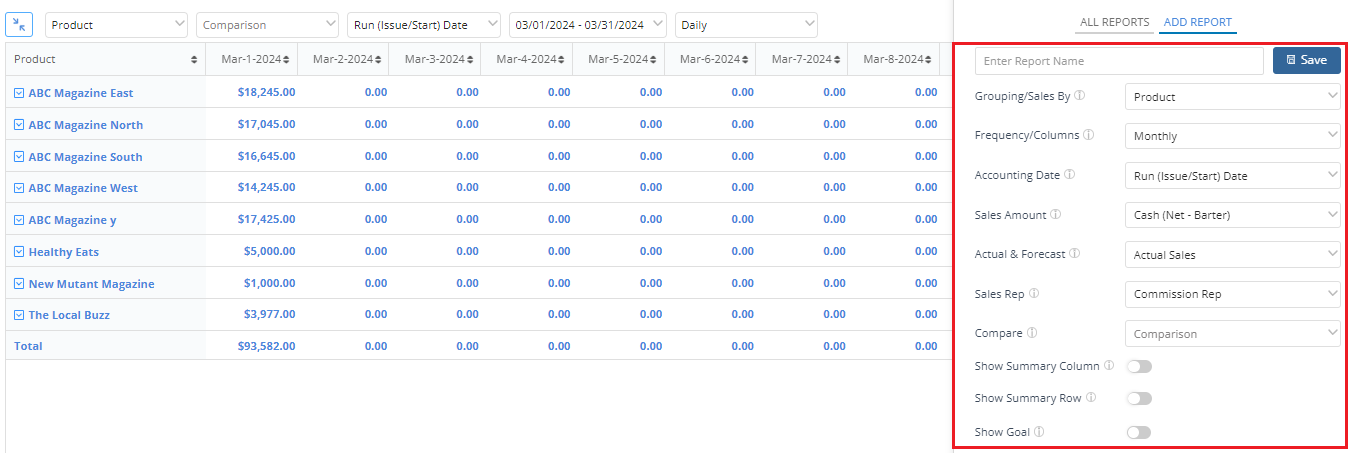
Add Report tab: Ability to build custom Reports as public or private. Through here, users can set how to have the data displayed using different criteria like Groupings, Frequency, Comparison options, Accounting Date, Actual & Forecast and Sales Amount. In addition to that, the totals can be displayed horizontally or vertically using the ‘Show Summary Column’ and ‘Show Summary Row’ toggles.
How to get the Goals Report
The Show Goal toggle in the ‘Add/Edit’ Reports window within the Revenue & Goals Module helps admins to set and view Goals alongside their Sales data, if enabled
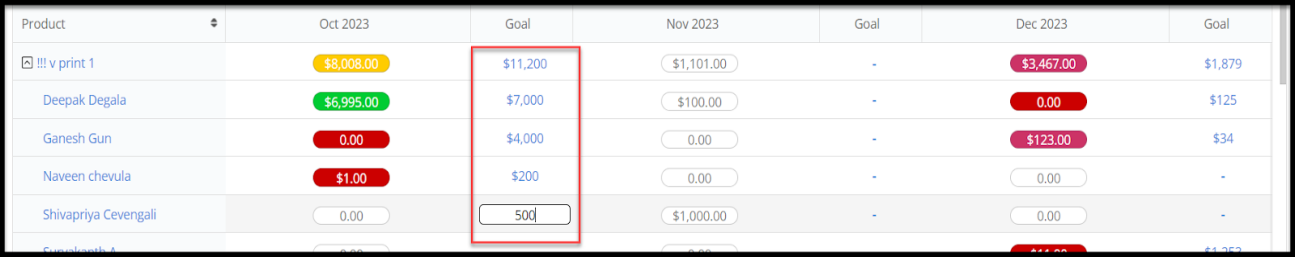
- A Goal and % to Goal columns will appear on the Report. Admins will be able to click-to-edit the Goal amount if the report is set to ‘Monthly’ and the secondary grouping is expanded. They will not be able to enter the Goal on the primary grouping line – the number shown on the primary grouping level will be the SUM of the Goals entered in the secondary grouping lines.
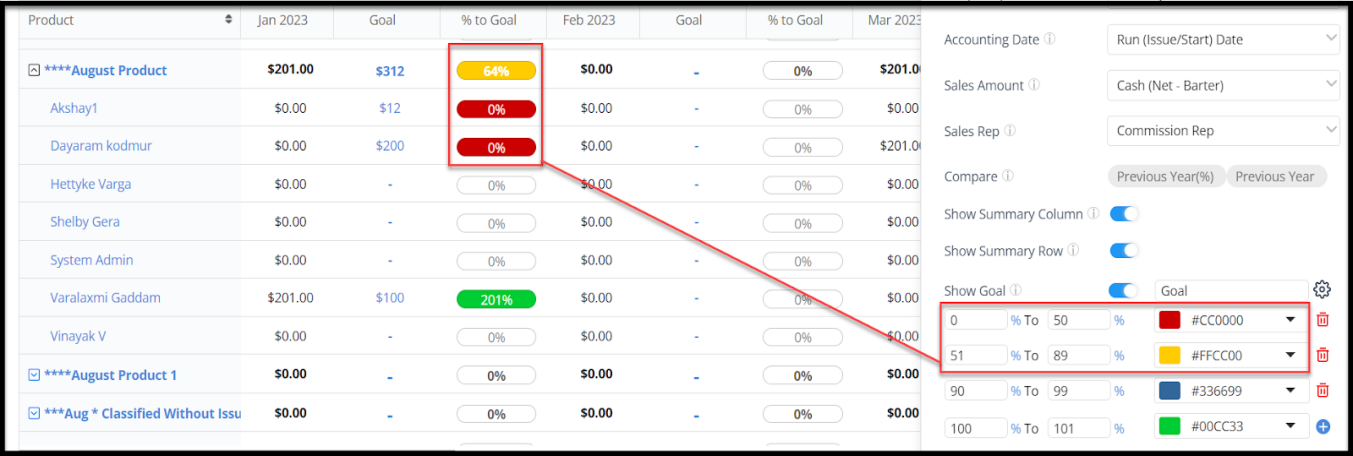
- A Text box and Settings icon will appear in the side panel window.

This text box will determine the Goal column header. By default, it will be ‘Goal’ but can be edited. And, through the Settings icon, admins will be able to set % to goal complete ranges (0%-25%, 26%-50%, 51-100% etc.) and assign colors to each range so if the current Sales amount falls within a certain percent-to-goal range, the Sales amount will appear in a bubble with the assigned color on the report.
 NOTE:
NOTE:
- Admins can create up to any number of percent-to-goal ranges by clicking on the blue + icon and can delete ranges with the trash can icon.
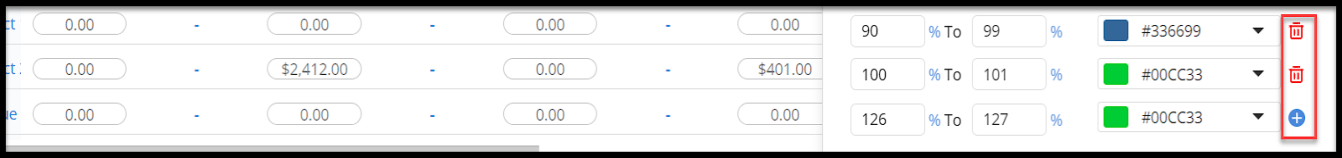
- The ranges need to be entered sequentially. If one is 0-25% the next has to start at 26%.
- Admins can only enable the Show Goal toggle if the Frequency is set to Monthly, Quarterly, or Yearly. It will be gray and unclickable for Daily, Weekly, and By Issue.
- Admins can only make edits to the percent-to-complete ranges if the Frequency is set to Monthly. For Quarterly or Yearly, this section will appear grayed out and unclickable.
- When grouping the report ‘By Customer’, the Goals will not appear.
- Compare options will be grayed out and unclickable.
We want to hear from you!


